The Employment
Development Department (EDD) released the state and local employment reports
for the month of November. Total California nonfarm employment increased by
5,500 jobs over the month in seasonally adjusted (SA) terms. Before adjusting
for seasonality, the gain was 78,600 jobs. The year-over-year change showed an
increase of 417,100 jobs (SA). This equated to a growth rate of 2.6%. This was
the slowest rate of increase since September 2012 when it was 2.5%, but still
exceeded the November national increase of 1.9%. California’s private sector
added 378,400 jobs (an increase of 2.8% over the year), while employment in the
public sector rose by 1.6% (38,700 jobs).

Industry
employment held to trend in November with nine of the 11 super-sectors adding
jobs over the year: construction; trade, transportation and utilities;
information; financial activities; professional and business services;
educational and health services; leisure and hospitality; other services; and
government for a combined gain of 424,300 jobs. Professional and business
services posted the largest gain on a numerical basis, adding 116,000 jobs (up
4.7%), while construction continues to claim the largest gain in percentage
terms, increasing by 5.9% and adding 41,000 jobs.
Two industry sectors
recorded a decline in November. Mining and logging employment dropped by 9.3%,
a loss of 2,900 jobs, while manufacturing employment was down by 0.3% or 4,300
jobs.
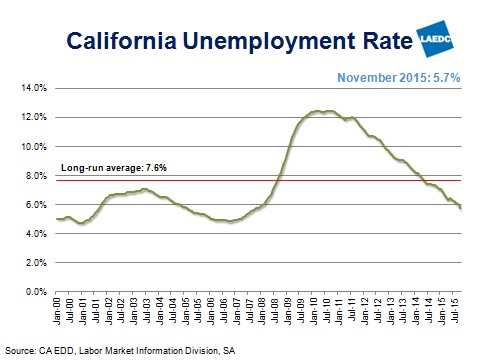
California’s
unemployment rate declined slightly from 5.8% in October to 5.7% in November
and was down from the year ago rate of 7.2%. California’s unemployment rate is
now the lowest it has been since November 2007 when it was also 5.7%. The
number of employed persons in California now stands at 17,910,100 (an increase
of 2.1% over the year), while the number of unemployed workers tumbled by 20.2%
over the same period to 1,081,800 in November. Although California has been
working its way up the ranks, it still had the 13th highest
unemployment rate in the nation last month, while at 2.7%, North Dakota had the
lowest.
County
highlights:
(Note: With the exception of the Los Angeles
unemployment rate, county level numbers are not seasonally adjusted, which
means there can be large month-to-month fluctuations in job counts. A truer
picture of how local labor markets are faring is revealed by focusing on the
year-over-year numbers. Annual trends “correct” for the seasonal factors that
influence certain industry sectors over the course of the year.)
In Los Angeles
County, the seasonally adjusted unemployment rate was 5.9%, down from 6.0% in October
and below the year ago rate of 8.0%. Total nonfarm employment (not seasonally
adjusted) increased by 22,200 jobs over the month and was up over the year by 73,200
jobs, an increase of 1.7%.
Educational and
health services posted the largest year-over-year gain in employment in November
with a net increase of 22,400 jobs. The health care industry added 24,800 jobs,
but a decline of 2,400 jobs in educational services partially offset the
increase.
Also recording
significant job gains were leisure and hospitality, which picked up 19,700
jobs, 87% of which were in accommodation and food services, and professional
and business services employment with the addition 15,900 jobs.
Four major
industry sectors reported year-over-year declines in November: manufacturing
employment contracted by 7,500 jobs; information lost 7,300 jobs; financial
activities was down by 300 jobs, and in the mining and logging sector, job
counts fell by 400.
In November, the
unemployment rate in Orange County was 4.2%, down from 4.3% in October and below
the year-ago figure of 5.2%. Nonfarm payroll jobs increased by 11,600 over the
month and were up by 39,000 over the year (an increase of 2.5%).
In the
Riverside-San Bernardino area, the unemployment rate in November was 6.1% compared
with 6.3% in October and below the year ago estimate of 7.6%. The Inland Empire
gained 17,900 nonfarm payroll jobs over the month and 46,100 over the year.
This represented an increase of 3.5%.
In Ventura
County, the unemployment rate was 5.4%, unchanged over the month but down from
the year ago estimate of 6.6%. Total nonfarm employment was up by 2,400 jobs
over the month and by 8,500 jobs over the year (up by 2.9%).
Summary: California led the
nation with the largest annual wage and salary job gain of 417,100 in November,
while the unemployment rate fell to its lowest in over eight years. In Southern
California, every region saw decreases in unemployment rates and job gains in
key industries such as health care, professional and business services,
construction, and leisure and hospitality.